
"Valuing a company is part science, part judgment — and comparable company analysis is where the two meet."
"This article draws heavily from Investment Banking by Joshua Rosenbaum and Joshua Pearl — an essential read for anyone serious about corporate finance." Lets begin.
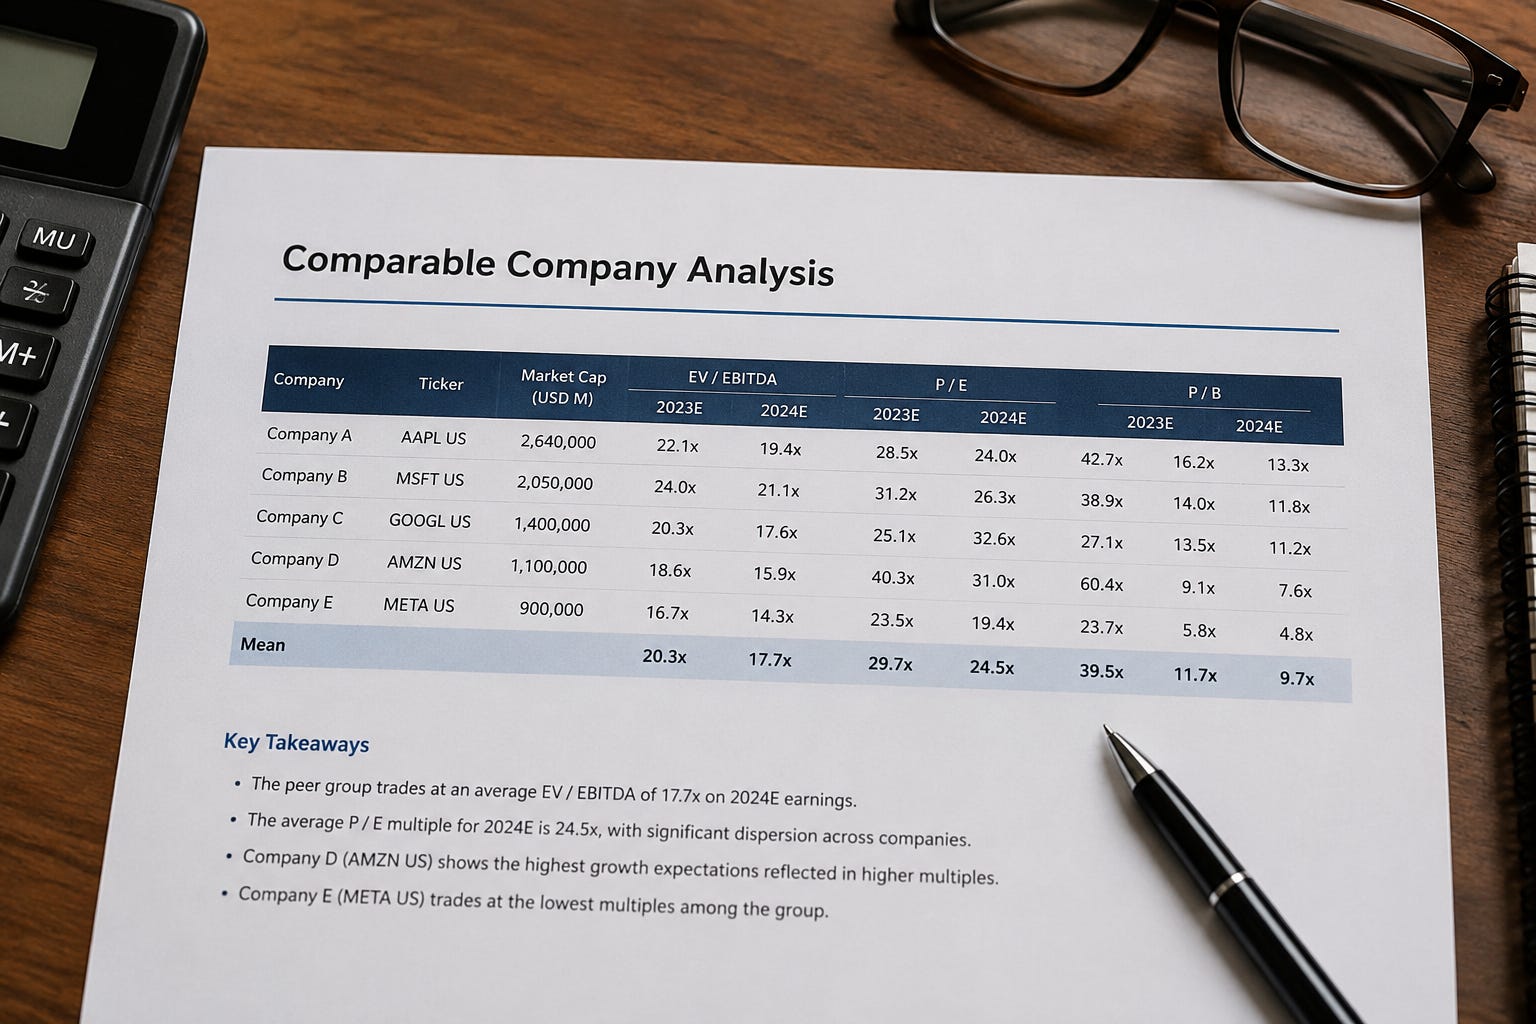
Comparable company analysis is one of the primary methods of used to value companies along with DCF (discounted cash flow), asset based valuation, precedent transaction analysis etc. It help us to value a private company & to help analyze value for public company. The foundation of comparable company analysis is that similar companies should trade at similar multiples due to the fact that they share similar business, financial characteristics, performance drivers and risk factors. The core of the analysis if to find out appropriate peers of the target company, peers are then bench-marked against one another based on financial ratios & statistics. The valuation range is then calculated by applying selected multiples to target relevant financial ratios/stats.
2 most common multiples used for bench marking are - P/E multiple and EV multiples
P/E multiples are most popular among retailers, within banking sphere EV multiples are widely used as they are unrelated to business operations.
Step by step approach to comparable company analysis:
Selecting the universe of comparable companies
Locate the necessary financial information
Spread key stats, ratio and trading multiples
benchmark comparable companies
Determine valuation.
lets dive into each step one by one:
#Selecting the universe of comparable companies:
The foundation of comparable companies analysis is to find out appropriate comparable company, to find out appropriate comparable we need to understand the target company very well. This could be easy for certain sectors and difficult for others.
For companies with no clear publicly traded comparable banker seek companies outside the target’s core sector that share business & financial characteristics on fundamental level.
For eg, Publicly trading window manufacturing company has no publicly trading peer, If universe could be expanded to include companies that manufacture building products, serve home builders or have exposure to housing cycles the probability of locating company with similar business drivers is increased. In this case we can include related building products manufacturer such as decking, roofing, doors & cabinets etc.
Study the target first: Studying the target is essential to determine appropriate comparable at this stage banker is encouraged to read & study as much as possible about the company and the sector as a whole through sector specific material. selection of comparable happen only after understanding of target companies business model.
Screen target: Once the target company business is well understood banker use various resources to screen for potential comparable companies, At this stage focus is on identifying companies with similar business profile. Best is to start with examining competition of the target company. competition share business risk and character and we can find them in equity research reports especially initial coverage reports, investment presentations or in sector reports.
# Locate the necessary financial information:
The section provide overview of various sources for necessary information to calculate ratios and multiples of selected companies.
Common sources include: SEC filings (US companies), earning announcements, investment presentations, equity research reports, consensus estimates, press releases etc. Company analysis can be done historically & forward looking, for future years financial performances are typically sourced from consensus estimates as well as equity research reports.
#Spread key statistics, ratios & Trading multiples:
Calculation of key statistics & ratios: Here we will calculate key stats & ratios of the target and comparable companies based on certain metrics such as:
Size ( Market value, equity value, enterprise value, key financial data such as sales, gross profit, EBITDA, EBIT & net income).
Profit ( Gross profit, EBITDA, EBIT & net income margin)
Growth profile ( historical & estimate)
Return on investment ( ROIC, ROE, ROA & dividend yield)
Credit profile ( leverage ratio, coverage ratios, credit rating)
Lets understand some important concepts being discussed in the list.
#Equity value: Popularly known as market value or market capitalization is calculated by multiplying market price and fully diluted out standing shares.
Calculation of fully diluted share outstanding: Its calculated by adding no. of shares represented by in the money options, warrants & convertible securities to basic share outstanding.
A) Options and warrants- Treasury stock method (TSM):
TSM assume that in the money options & warrants exercised at strike price with resulting option proceed used to repurchase outstanding shares of stock at company current price. As the option strike price is less than current market price the no. of share repurchased is less than additional share outstanding from exercise of option resulting in net issuance.
B) Convertible & equity linked securities- If convertible method:
It include broad range of instrument such as convertible bond, convertible preference stock etc. under if convertible method if convertible are in the money they are converted to additional shares. convertible debt also leads to upward adjustment of net income to account for foregone interest expense adjusted for tax associated with coupon on convertible.
# Enterprise Value (EV): EV is sum of all ownership interest in company & claim on its assets from both debt & equity holders.
EV= Equity value+ debt value+ preference share + non controlling interest - cash & cash equivalent.
EV is considered to be independent of capital structure, lets understand this with an example,
Eg 1: If unlevered company issue debt then debt increase and cash increase overall EV remains stable.
Eg 2: If company issue equity to payoff debt, then equity value increase is offset by decrease in debt value.
Supplementary financial concepts to know:
Calculation of LTM: companies report performance quarterly, therefore in order to measure financial performance for LTM period. company result of previous 4 quarters are summed.
LTM = prior fiscal year + current quarter - same period quarter last year
Calenderization: US companies report data as on 31 December while other companies report data as on 31 march. variation in fiscal year end among comparable can distort comparison.
To account for variation each country’s financial is adjusted to common period for clear comparison, this is known as calenderization.
Adjustment of non recurring items: To assess company’s financial performance on “normalized” basis, it is standard practice to adjust reported financial data for non recurring items a process called normalized earnings.
These include: Adding back one time charges or removing one time gains, in many cases banker have to use discretion to determine whether certain expenses are recurring or non recurring.
For eg, large pharma companies may find themselves in courts regularly due to lawsuits by drug manufacturers related to patents.
When adjusting for non recurring items its important to keep in mind pre tax and post tax adjustments
Pre-tax restructuring cost is added back to calculate adjusted EBIT & EBITDA, to calculate net income pre tax charges need to be tax adjusted before adding back
Post tax could be added back directly to net income but need to be grossed up for EBIT and EBITDA.
#Calculation of key multiples:
While companies can have different multiples according to their sector the generic structure include a measure of market valuation in numerator ( EV or equity value) and company’s financial performance metric in denominator ( EBIT, EBITDA or net income)
For EV multiple denominator has profit metric that flow to both debt and equity such as EBIT and EBITDA.
For equity value multiples the denominator must have financial metric that is only for equity shareholders like net income.
Equity value multiples (P/E): Current market price divided by EPS, this ratio can be viewed as measure of how much an investor are willing to pay for a dollar of company’s current or future earning.
P/E can be based on forward outlook using forward EPS, high P/E shoe high investor earning growth expectations.
P/E is relevant for mature companies and that have shown ability to show consistent growth.
Limitations of P/E - not relevant for company’s with no positive earnings, net income is net of interest this means it depend on capital structure of the company as a result two comparable companies can have different net income due to difference in capital structure leading to different P/E.
Enterprise value multiples: EV is for both debt and equity, most popular EV multiple are EV/EBIT, EV/EBITDA, and EV/sales.
A.) EV/EBITDA or EBIT: EV/EBITDA is independent of capital structure and taxes as well as distortion that may arise from differences in depreciation and amortization.
If one company did capex recently and other didn’t then company who did capex will have a larger value of depreciation and amortization for current period, this will effect its EBIT margins but not EBITDA margin.
For this reason to prevent probability of discrepancy in multiples of company with recent acquisition or capex, EV/EBITDA is used not EV/EBIT.
B.) EV/Sales: Sales give indication of size but not necessary converts to profits or cash flows, In certain sectors & company with little to no profits EV/Sales can be relied upon as measure of valuation multiple.
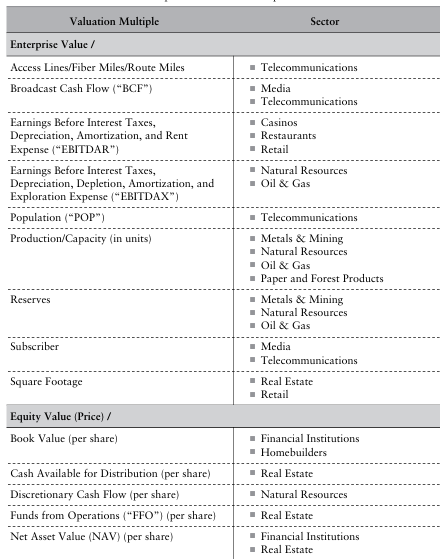
{ We have discussed sector specific ratios at the end do read them }
# Bench marking the comparable companies:
Once initial comparable companies are known is selected & key financial statistics, ratio are spread the banker is set to perform bench marking analysis.
Ultimate objective of bench marking is to derive target’s relative ranking so as to frame valuation accordingly.
We have broken bench marking into 2 parts:
We benchmark key financial ratios & stats for target and its comparable in order to establish relative positions, with focus on finding the closest or the “Best” comparable and noting the outliers.
We analyze and compare trading multiple of peer group, placing particular emphasis on best comparable.
A.) Bench marking financial ratios and stats: The first stage of bench marking involve comparison of target & comparable universe on basis of key financial performance metric, this metric can involve size, profit, growth, return and credit.
Bench marking goes beyond qualitative comparison of comparable financial metric, in order to access target relative strength banker need to have a strong understanding of each comparison company’s story. Eg: reason for such high growth? why margins are greater or lower for a company? Is company a market leader? Is company gaining or losing market share? etc.
The ability of a banker to interpret such issues are critical to develop targets relative position.
B.) Bench marking trading multiples: This enable analyst to look at range of multiples and access relative valuation for each companies comparables.
As with ratio, analyst calculate mean, median, high and low for range of multiples providing a reference point of target range. Once trading multiples are analyzed the banker conduct further refining of comparable depending on resulting output, it may become apparent that certain outliers need to be removed.
# Determining Valuation:
Trading multiple of comparable companies serve as basis for deriving appropriate valuation range. banker typically use mean or median of most relevant multiple of sector to extrapolate highest range.
Multiple of best comparable resource are typically relied upon as guide post for selecting highest range.
As part of exercise banker must also determine which financial period data is most relevant for calculating multiples.
Depending on sector, point in business cycle, comfort with consensus estimate comparable companies may be trading on basis of LTM, 1Y forward or 2 years forward.
Selected multiple are then applied to target company to finally calculate our implied value.
As closing its important to understand areas where bankers can make mistakes, most common among them are:
Inclusion or over emphasis of inappropriate comparable companies.
Incorrect calculation of LTM, EV, diluted share oustanding, equity value etc.
Failure to incorrectly remove non recurring items.
Some sector specific ratios:
{Thank you for reading till end to share your opinion on the topic}